Litecoin Price Analysis: LTC Creates At 20-Month Low Against BTC, Is The Pain Over?
Litecoin has been dragged through the mud recently after suffering a 13.55% price decline over the past week. This brought its price to $63.93 as it broke beneath a long-term rising support line. Litecoin has now dropped by a substantial 33% in the past 30 days alone as investors wonder how long this could possibly go.
LTC remains the fifth-largest cryptocurrency with a market cap of $4.05 billion.
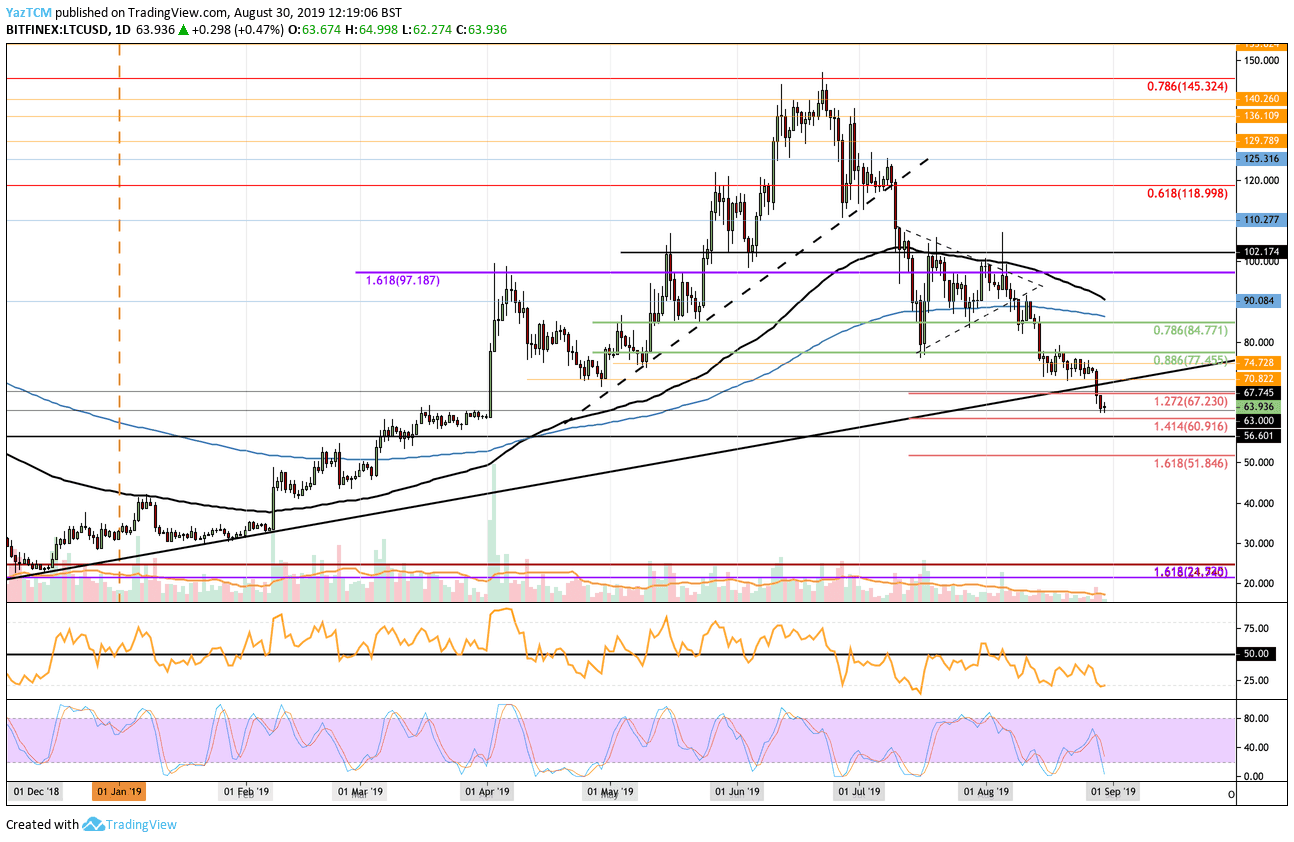
Looking at the LTC/USD 1-Day Chart:
- Since our previous Litecoin analysis, Litecoin continued to fall drastically and broke below the 2019 year long rising support trend line which we had expected would hold the market. Litecoin continued further beneath this until finding support at around $63 where the decline has briefly stalled.
- From above: If the bulls can defend $63 and push higher, immediate resistance lies at $67.23 and $70. Higher resistance is located at $74, $77.45, $80, and $85. The resistance at $80 is bolstered by the 200-days EMA.
- From below: If the sellers break beneath $63, initial support lies at $60.91 (downside 1.414 Fib Extension) and $60. Below $60, support is expected at $56.60 and $51.84 (downside 1.618 Fib Extension).
- The trading volume has increased slightly during the latest round of selling.
- The RSI is well beneath 50 as it trades in oversold conditions. For a sign of recovery, look for the RSI to rise back toward the 50 level as this will show that the selling momentum is fading.
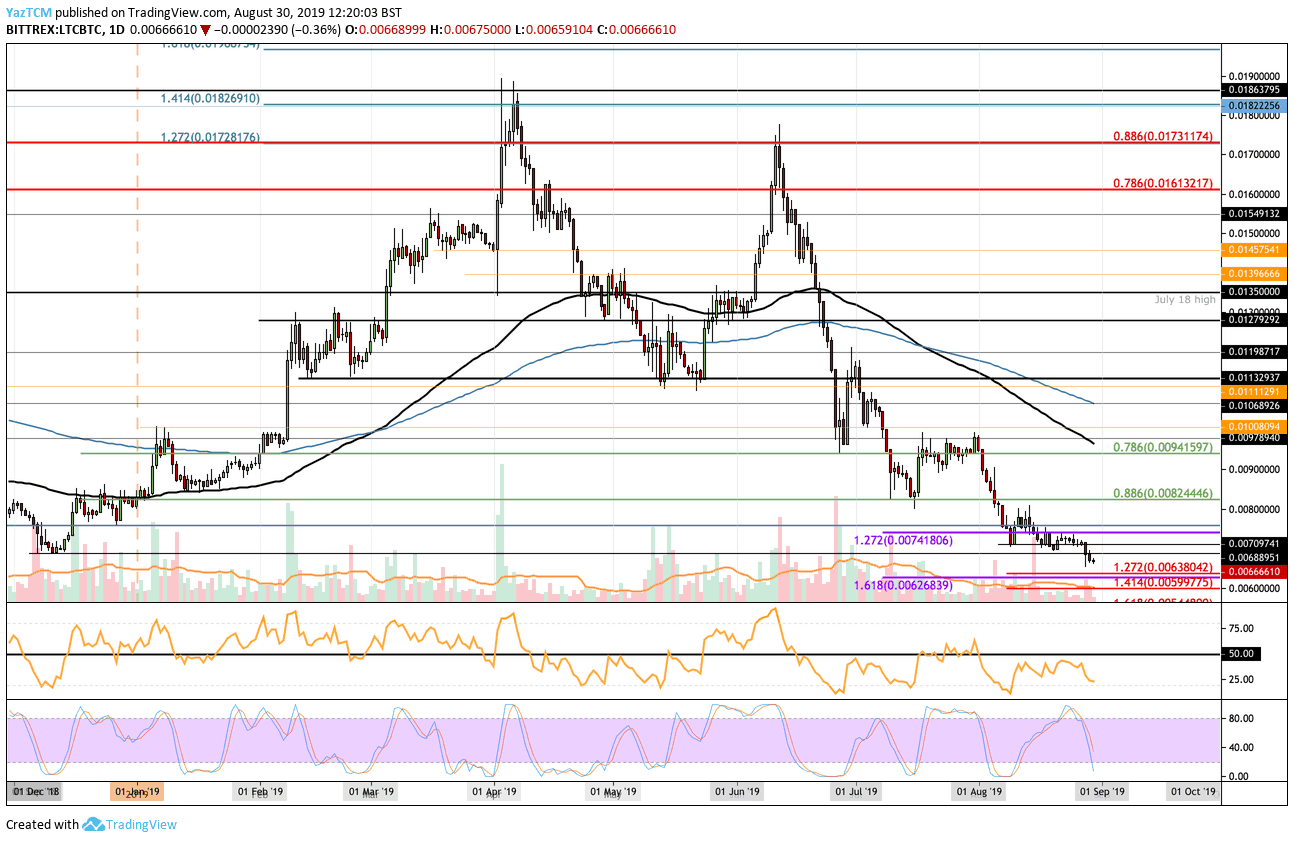
Looking at the LTC/BTC 1-Day Chart:
- Against Bitcoin, LTC continued to fall beneath the 2018 low at 0.0068 BTC and headed south to where it currently trades at 0.00666 BTC. This latest price drop has actually created a fresh 20 month low as this price has not been seen since December 2017.
- From above: The nearest levels of resistance lie at 0.00688 BTC and 0.0070 BTC. Above this, resistance lies at 0.0074 BTC, 0.0080 BTC, 0.008244 BTC, and 0.0090 BTC.
- From below: Initial support is located at 0.0065 BTC and then at 0.006380 BTC (red downside 1.272 Fib Extension). Further support is expected at 0.0062 BTC and 0.0059997 BTC.
- The trading volume has also spiked higher during the previous sell-offs.
- The RSI is not as quite as oversold here, which unfortunately suggests there is some space for the market to head even lower.
The post Litecoin Price Analysis: LTC Creates At 20-Month Low Against BTC, Is The Pain Over? appeared first on CryptoPotato.
from CryptoPotato https://ift.tt/2MLjOId
via IFTTT


Kommentare
Kommentar veröffentlichen