Ethereum Price Analysis: ETH Plunges Below $300, But Gains Momentum Against Bitcoin
Ethereum has been slipping over the past 24 hours; dropping by a total of 4% back below the $300 mark, currently trades around $293. The recent price fall is mostly due to the past hours’ Bitcoin falling back toward the $11,000 (as of writing this).
Ethereum currently holds a $31.5 billion market cap value which puts it in second place amongst the top cryptocurrency projects by market cap valuation. The cryptocurrency has seen an epic 108% price explosion over the past three months – despite that the cryptocurrency was dropping against BTC.
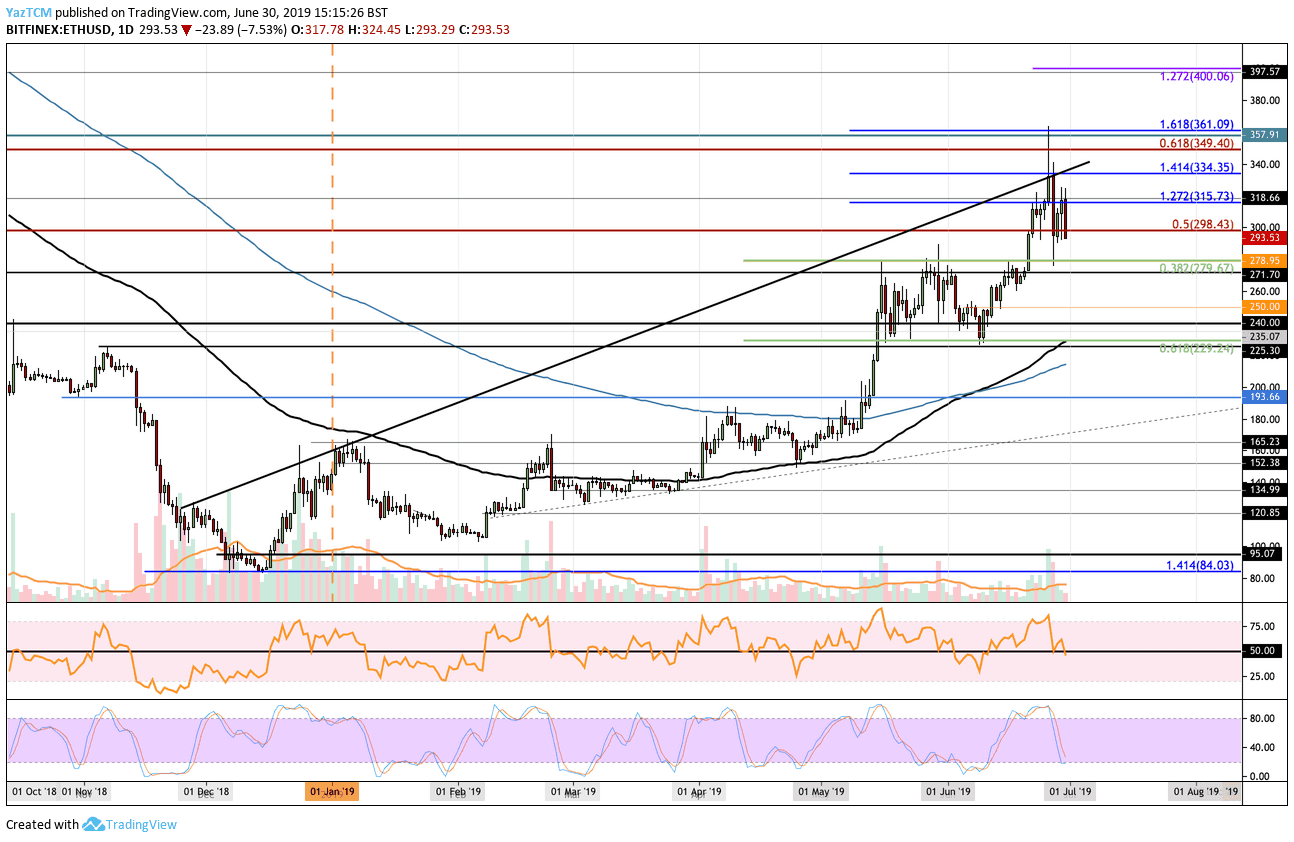
Looking at the ETH/USD 1-Day Chart:
- Since our previous ETH/USD analysis, we can see that ETH went on to spike higher into the resistance at the $360 level but was unable to hold at that level. Ethereum has since fallen and has recently dropped beneath $300.
- From above: The nearest level of resistance now lies at the $300 level. This is followed with higher resistance at $315, $334 and $350. Above $350, further resistance lies at $360, $380 and $400.
- From below: The nearest level of strong support lies at $280, which contains the short term .382 Fib Retracement. Beneath this, lower support can be found at $271, $250, $240, $235 and $229 (contains .618 Fib Retracement).
- The trading volume has fallen drastically over the past few days following the spike toward the $360 level.
- The Stochastic RSI has recently reached oversold conditions as we wait for a crossover signal above to indicate that the buyers are ready to push higher. However, the RSI itself has dropped beneath the 50 level, which could mean there will be more bearish momentum on the way.
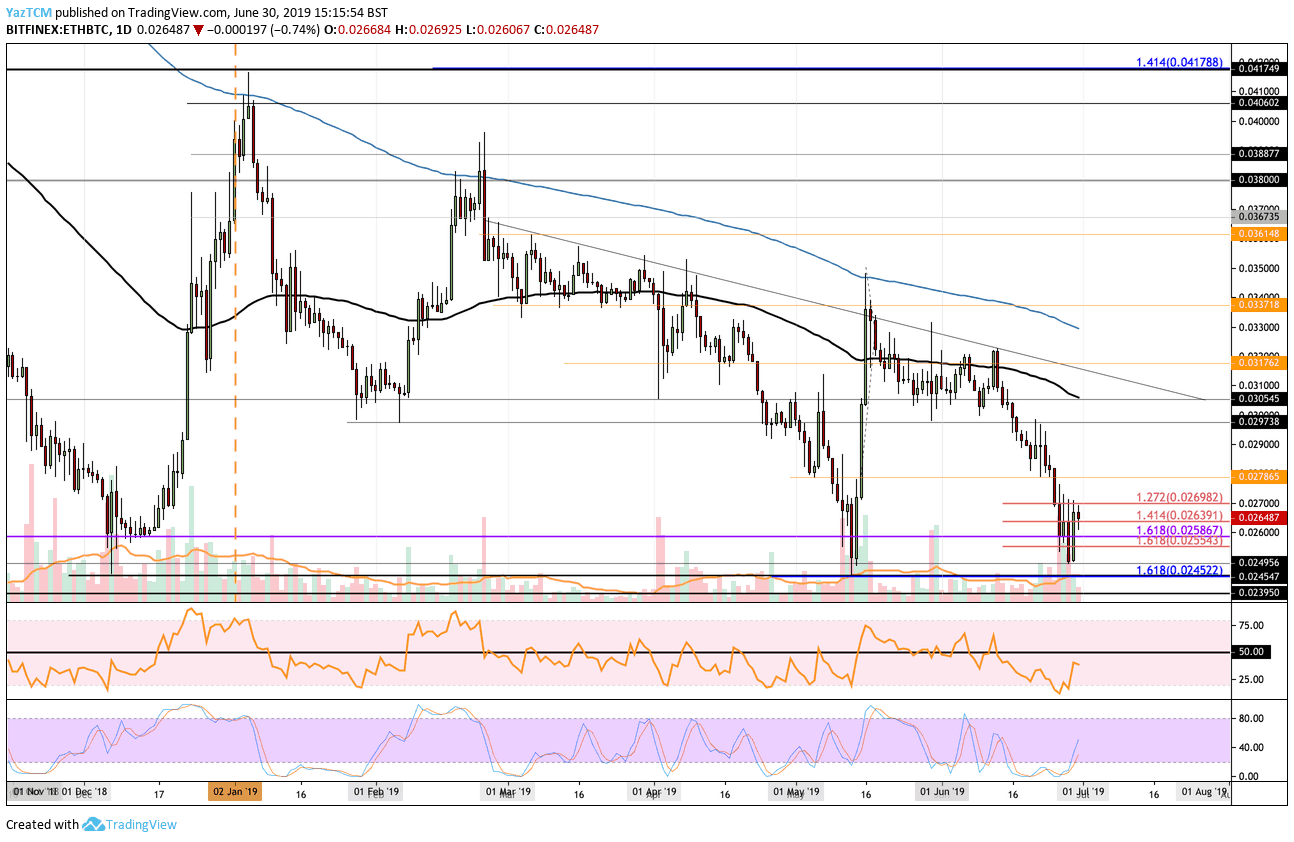
Looking at the ETH/BTC 1-Day Chart:
- Against Bitcoin, we can see that ETH went on to fall further lower until finding strong support at our highlighted level of 0.02495 BTC. This support had held the market during May 2019 which had allowed ETH-BTC to rebound higher. ETH-BTC has bounced from the support mentioned above to where it currently trades at around 0.02657 BTC.
- From above: The nearest level of resistance now lies at 0.027 BTC. Above this, higher resistance is located at 0.02786 BTC, 0.028 BTC, 0.029 BTC, and 0.030 BTC – which also contains the 100-days EMA. Above 0.03 BTC, further resistance is located at0.031 BTC and 0.03176 BTC.
- From below: The nearest level of support now lies at 0.02639 BTC and 0.026 BTC. Beneath this, further support lies at 0.02586 BTC, 0.02495 BTC, 0.0245 BTC, and 0.02395 BTC.
- Even though the trading volume has decreased slightly, it remains relatively high.
- The Stochastic RSI has recently produced a bullish crossover signal which allowed the market to rebound at the support. If it continues to climb, we can expect ETH-BTC to keep on rising.
The post Ethereum Price Analysis: ETH Plunges Below $300, But Gains Momentum Against Bitcoin appeared first on CryptoPotato.
from CryptoPotato https://ift.tt/2RGGeKg
via IFTTT


Kommentare
Kommentar veröffentlichen