Bitcoin Price Analysis: BTC Consolidation Amid $11K – Calm Before The Storm?
Since our previous BTC analysis and over the past three days, Bitcoin pattern had gone through a triangle formation. The apex of that triangle should be decided in 1-2 days. However, a breakout to any side could signal the next short-term direction for Bitcoin.
As can be seen on the following charts, Bitcoin reached down exactly to the short-term ascending-trend line support. The trend-line was forming since Bitcoin started its bullish strike from ~$7,500 to the current 2019 high at nearly $14,000.
Overall, the market is still bullish, showing significant strength in 2019, and especially over the past 60 days.
Aside from Bitcoin, by looking on the rising BTC dominance and the total market-cap, one could easily see that the Altcoin holders are suffering hard. This also means that during the last rise, most of it came from selling Altcoins to Bitcoin, and not from new money entering the crypto markets.
Total Market Cap: $335 billion
Bitcoin Market Cap: $208.5 billion
BTC Dominance Index: 62.0%
Support & Resistance
As can be seen on the 4-hour chart, Bitcoin is consolidating, whereas the lower boundary is also where lies the upper ascending trend-line (~$11,500). Keeping up the last level could signal another bullish move for BTC.
Breaking down, and Bitcoin is likely to check lower support levels at $11,200 – $11,300 (78.6% Fib level, prior high), $11,000, and $10,600. Further down is $9,800 – $10,000 and $9,400. In my opinion, as long as Bitcoin keeps up $9,400, the long-term picture is still green and healthy.
From above, Bitcoin marks the $12,000 – $12,200 area as the closest resistance zone. The next level is $12,500 before reaching the $13,000 again. Breaking the recent 2019 high at $13,880 (and the $14,000 area) would likely to send Bitcoin to the $15,000 zone since there is not much resistance along the way, including the next zones at $16,400 – $16,650, $17,400 (January 7, 2017, high), $18,000, $19,300 and $20,000 – the current all-time high from December 2017.
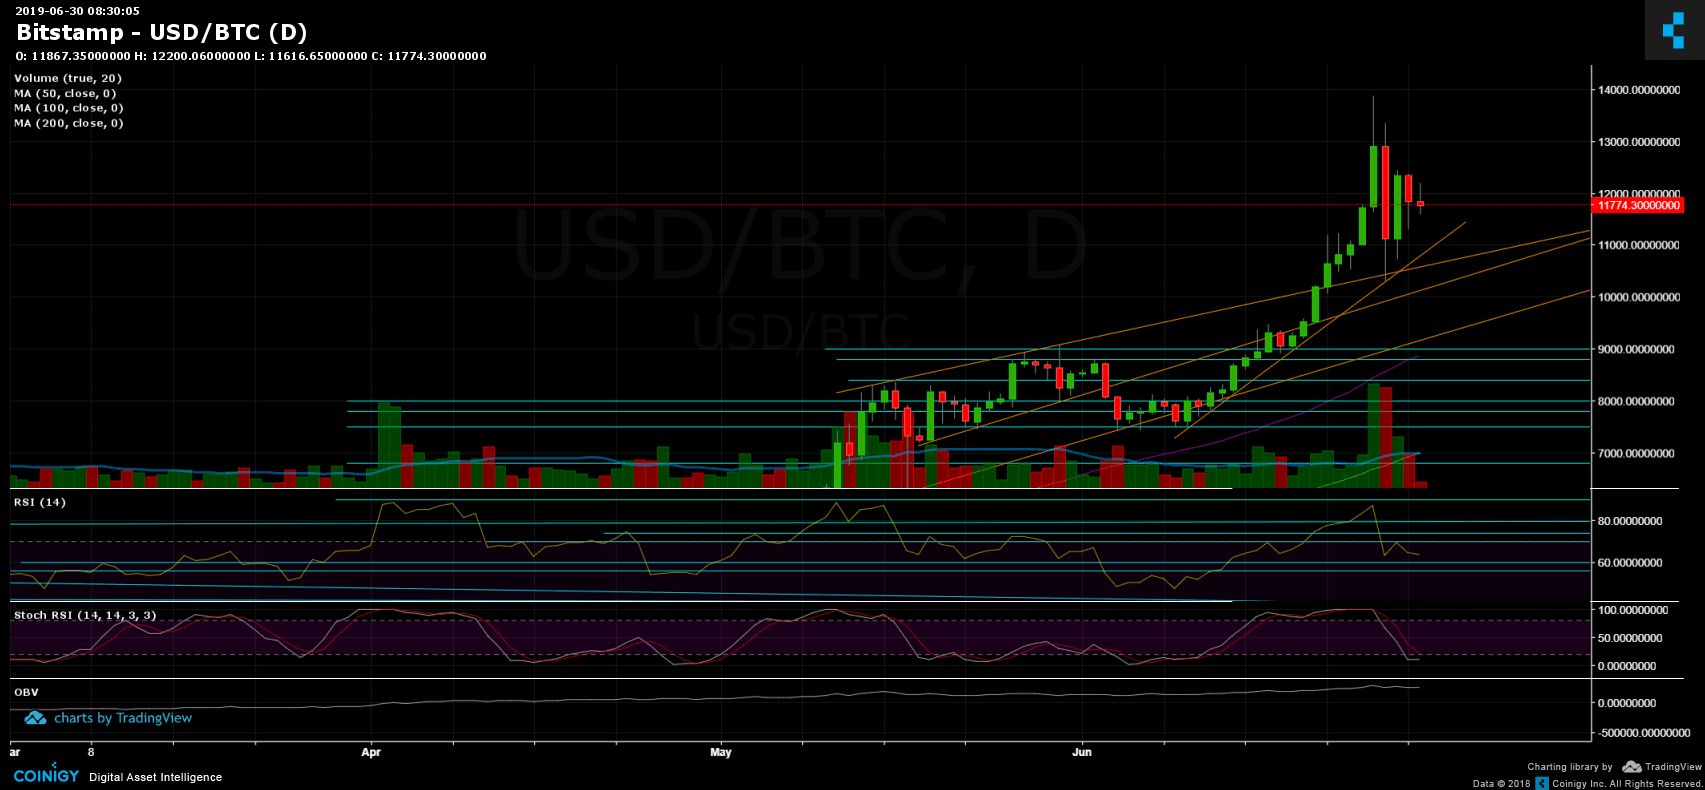
Daily chart’s RSI
After reaching the overbought area at 88-90, the RSI dumped down to 62. From there corrected to 70, and then rejected by the resistance. Over the past hours, the RSI is on top of the 62-support level again.
The Stochastic RSI Oscillator of the daily chart is about to generate a cross-over in the oversold territory. This can initiate another upside move in case the oscillator enters the bullish territory following a cross-over.
Trading Volume
The last Wednesday and Thursday were the top two volume days in 2019. However, we are still far from the crazy days throughout the recent so-called crypto bubble – from Nov 2017 to Feb 2018.
BitFinex open short positions
After reaching their 30 days high at 30.7K BTC, the number of short positions now lies at $29.8. Still relatively high in comparison to the past month.
BTC/USD BitStamp 4-Hour Chart

BTC/USD BitStamp 1-Day Chart
The post Bitcoin Price Analysis: BTC Consolidation Amid $11K – Calm Before The Storm? appeared first on CryptoPotato.
from CryptoPotato https://ift.tt/321NyFe
via IFTTT


Kommentare
Kommentar veröffentlichen