Bitcoin Price Analysis Dec.29: Following a Nice Breakout, Is Inverse H&S Evolving?
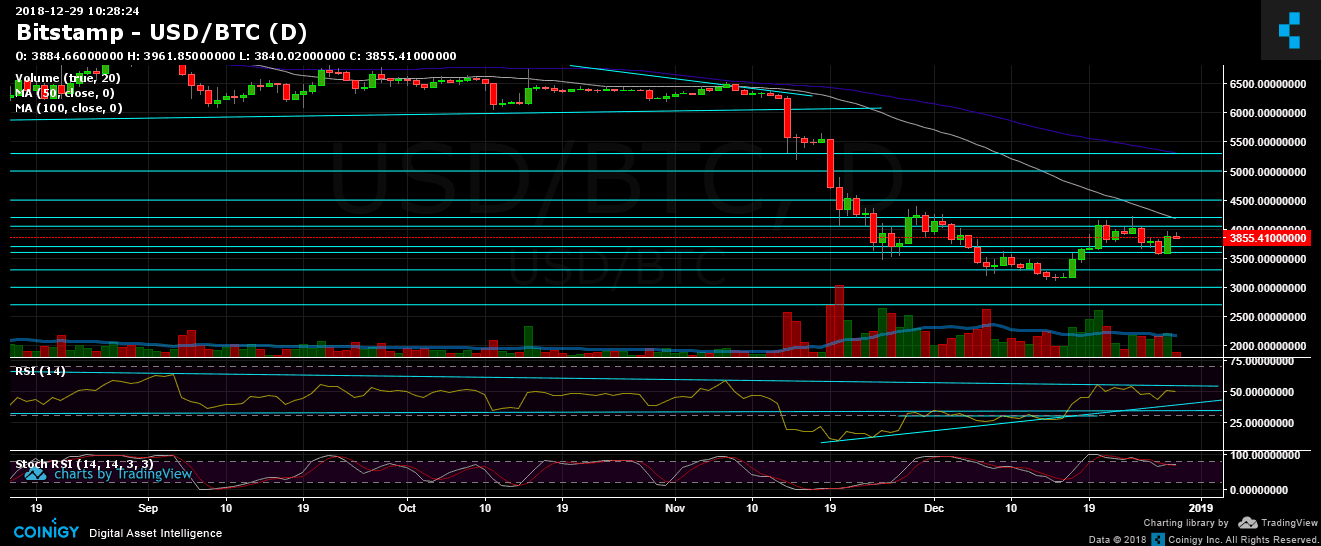
A quick weekend update: We can safely say that Bitcoin held on top the significant $3600 support line (along with the mid-term ascending trend line), following a decent green candle of over $300 that returned the coin close to the $4000 mark.
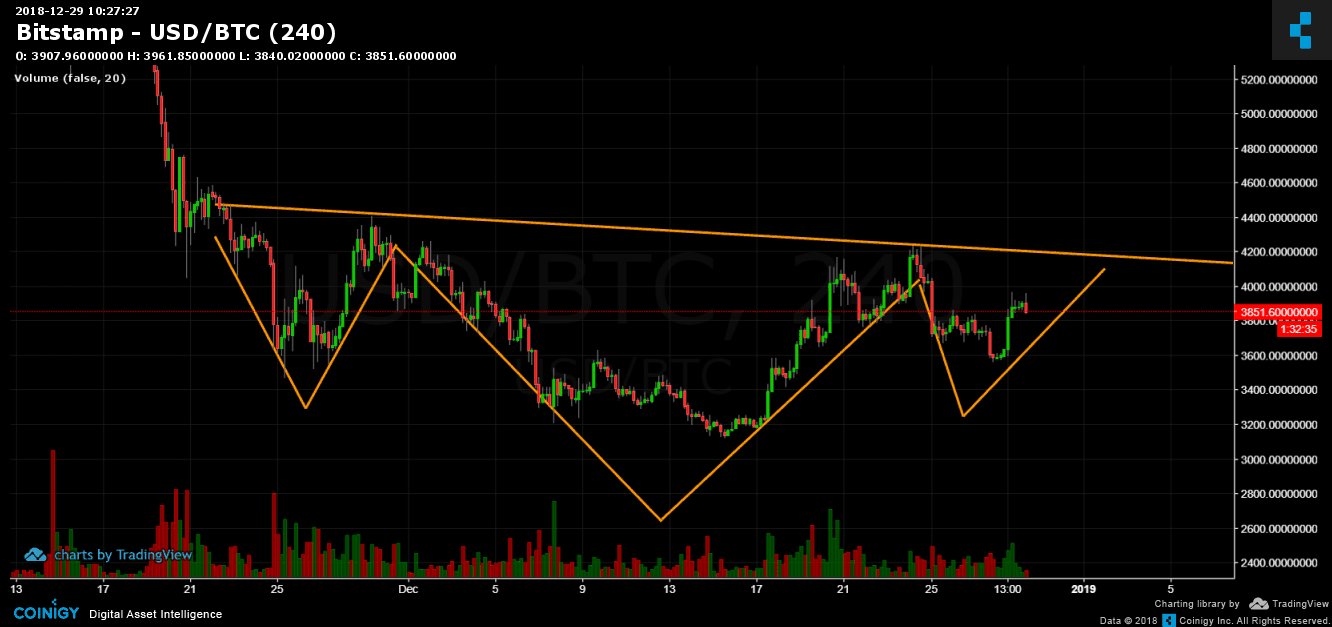
Despite the fact that the chances for a bearish continuation were higher, the bulls managed to keep up the $3600 support, and as of writing this, the last action could turn into a bullish inverse Head and Shoulders formation with immediate targets around $5000.
Looking at the 1-day & 4-hour charts
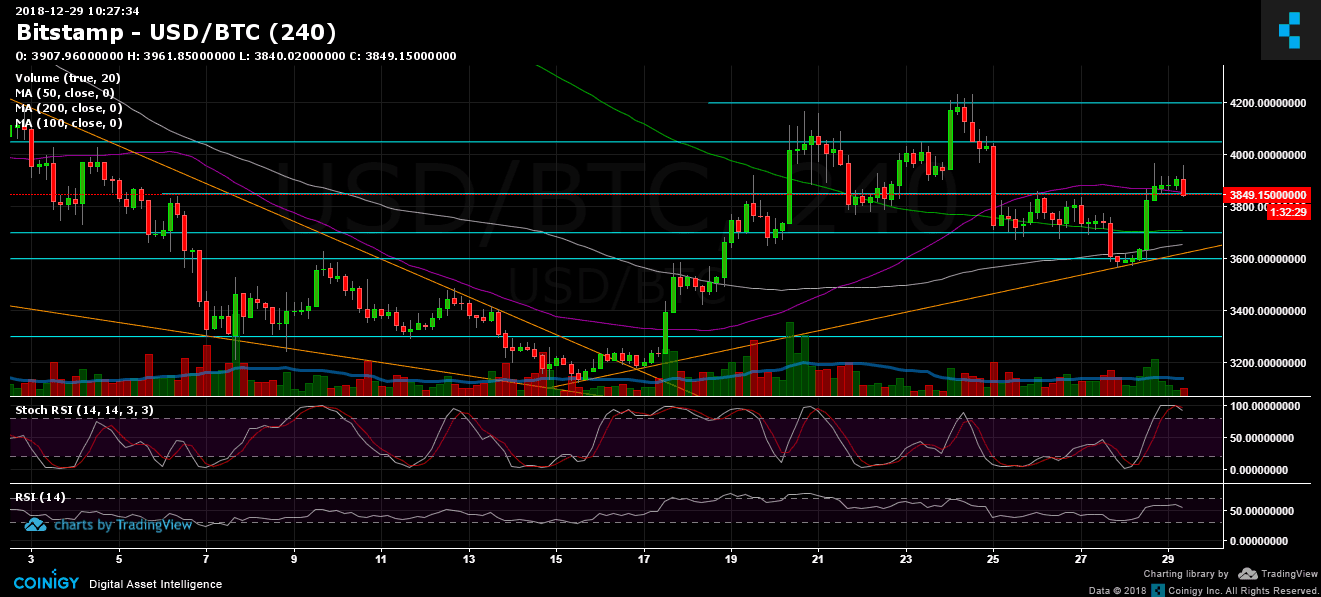
- Bitcoin is now above the last days’ trading range (between $3700 and $3850), whereas $3850 prior resistance had turned into a major support level, along with the 50 days moving average line (marked in purple on the 4-hour chart).
- The next bullish targets could be at $3950, $4050 and $4200. As a reminder, Bitcoin was testing those levels just a week ago.
- Looking on the broader picture, an inverse Head and Shoulders pattern might be evolving (can be seen on the following charts). In the case of a breakout of the neckline around ~$4200, Bitcoin could get immediate targets around the $5000 area.
- From the bear side, the closest support lies at $3850. Below is the 200 days moving average line around $3700, along with support level and the ascending trend-line. The next support level is the $3600 from yesterday.
- Stochastic RSI oscillator of the 4-hour chart is about to cross over around the overbought zone. As can be seen on the following chart, the last times it had crossed there (Dec.21 and Dec.24), Bitcoin had lost nearly 10% from its value. This support the possibility of a correction down, which is reasonable after yesterday’s gains.
- The trading volume had slightly increased, however, may be due to the weekend and holidays the volume levels are still considered low.
- BitFinex’s open short positions had decreased to 31.1K BTC, near their monthly low.
BTC/USD BitStamp 4-Hour chart
BTC/USD BitStamp 1-Day chart
The post Bitcoin Price Analysis Dec.29: Following a Nice Breakout, Is Inverse H&S Evolving? appeared first on CryptoPotato.
from CryptoPotato http://bit.ly/2AvjLc3
via IFTTT


Kommentare
Kommentar veröffentlichen