Bitcoin Price Analysis June.30
Just a quick update following the price action from recent hours: It might be related to the short 6-month CME options that should have been terminated somehow these days (the CME initialized at the end of December 2017, and it might be that the important zone of $5800 is still strong zone (we wrote about it yesterday).
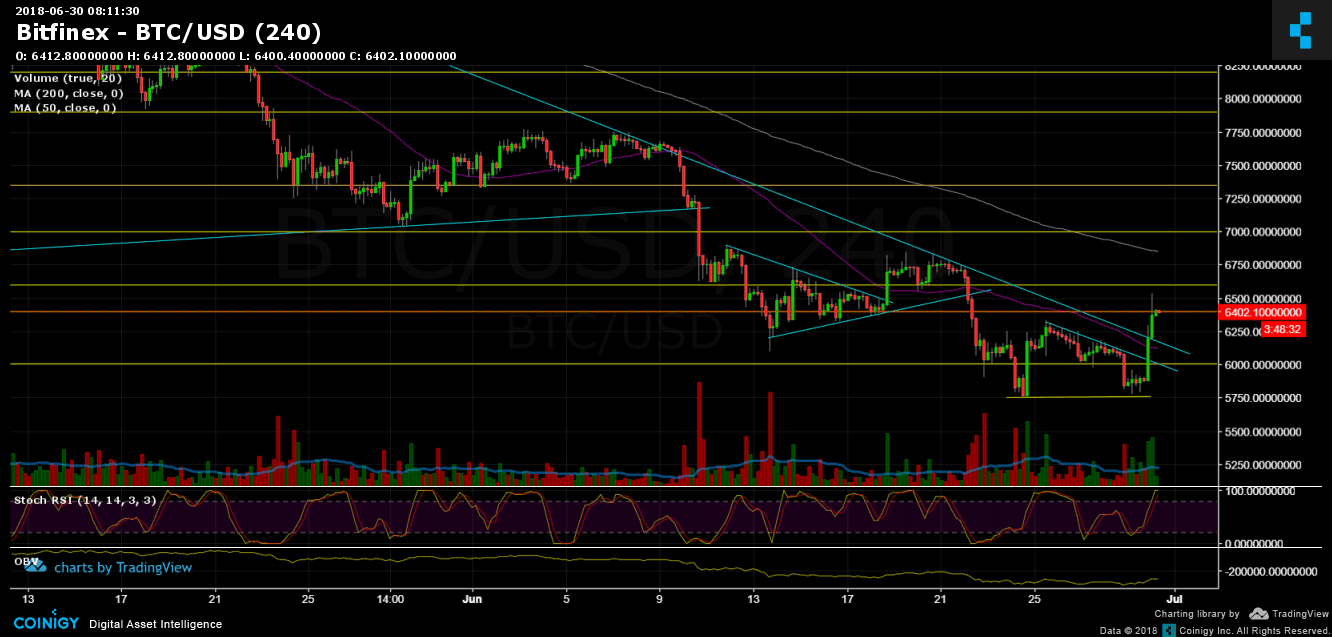
Bitcoin had a decent bullish green candle, breaking up the long-term descending line (the longer light blue line in the chart), followed by high volume of buyers. Was that the end of the bears, and from here BTC will hit 10K? only time will tell. Market is now overbought (Indicator: RSI) so a correction down might take place (FIB retracement is at $6270~ but can also be $6200). But overall, this nice green candle was really necessary for the market to stay alive and get away from the yearly low of $5800. Resistance levels are at $6600 (strong), $6800 (Moving average 200 days) and then $7000.
BTC/USD BitFinex 4 Hours chart
The post Bitcoin Price Analysis June.30 appeared first on CryptoPotato.
from CryptoPotato https://ift.tt/2KyKRSo
via IFTTT


Kommentare
Kommentar veröffentlichen